
From leaky subscribers tocompounding recurring revenue.
How a DTC supplement brand rebuilt the offer, the first 30 days, subscriber control and failed payment recovery.
The first order worked, but retention broke after checkout
Paid acquisition was bringing in buyers. The problem started after checkout, customers were not being guided toward the second order.
First order worked
Traffic, product demand and checkout were doing their job. New customers were entering the business every day.
Second order was weak
Only 38 of every 100 new subscribers reached Order 2. That means 62 were lost before the second renewal.
Revenue leaked later
Monthly churn was 15%, and only 12 of every 100 failed renewal payments were recovered.
“The first sale created revenue. Retention decided whether that customer became profitable.”
So the audit focused on what happened after checkout, not on adding more messages for the sake of sending more messages.
The audit found six connected leaks, not one isolated problem.
We mapped the customer journey from the product page to renewal, cancellation and failed payment recovery
Subscription was just a discount
The product page offered a basic subscribe and save discount, but it did not explain why staying subscribed was useful, flexible or easy.
Post purchase stopped at shipping
Customers received delivery updates, but they did not receive usage guidance, expectation setting or habit coaching.
Order 2 had no defense
There was no dedicated renewal journey before the second charge, even though the second order is where many new subscribers decide to stay or leave.
Subscriber controls were hidden
Skip, delay, swap and cadence controls existed, but customers were not shown those options before frustration turned into cancellation.
Cancellation was one size fits all
Every cancellation reason received nearly the same save message, even though different problems need different solutions.
Failed payments were treated as admin
Billing failures were not separated from intentional cancellations, so recoverable revenue was being lost without a deliberate recovery sequence.
The baseline dashboard showed where subscription revenue came from.
We used a 60 day window, Jan 15 to Mar 15, so every number could be compared on the same basis.
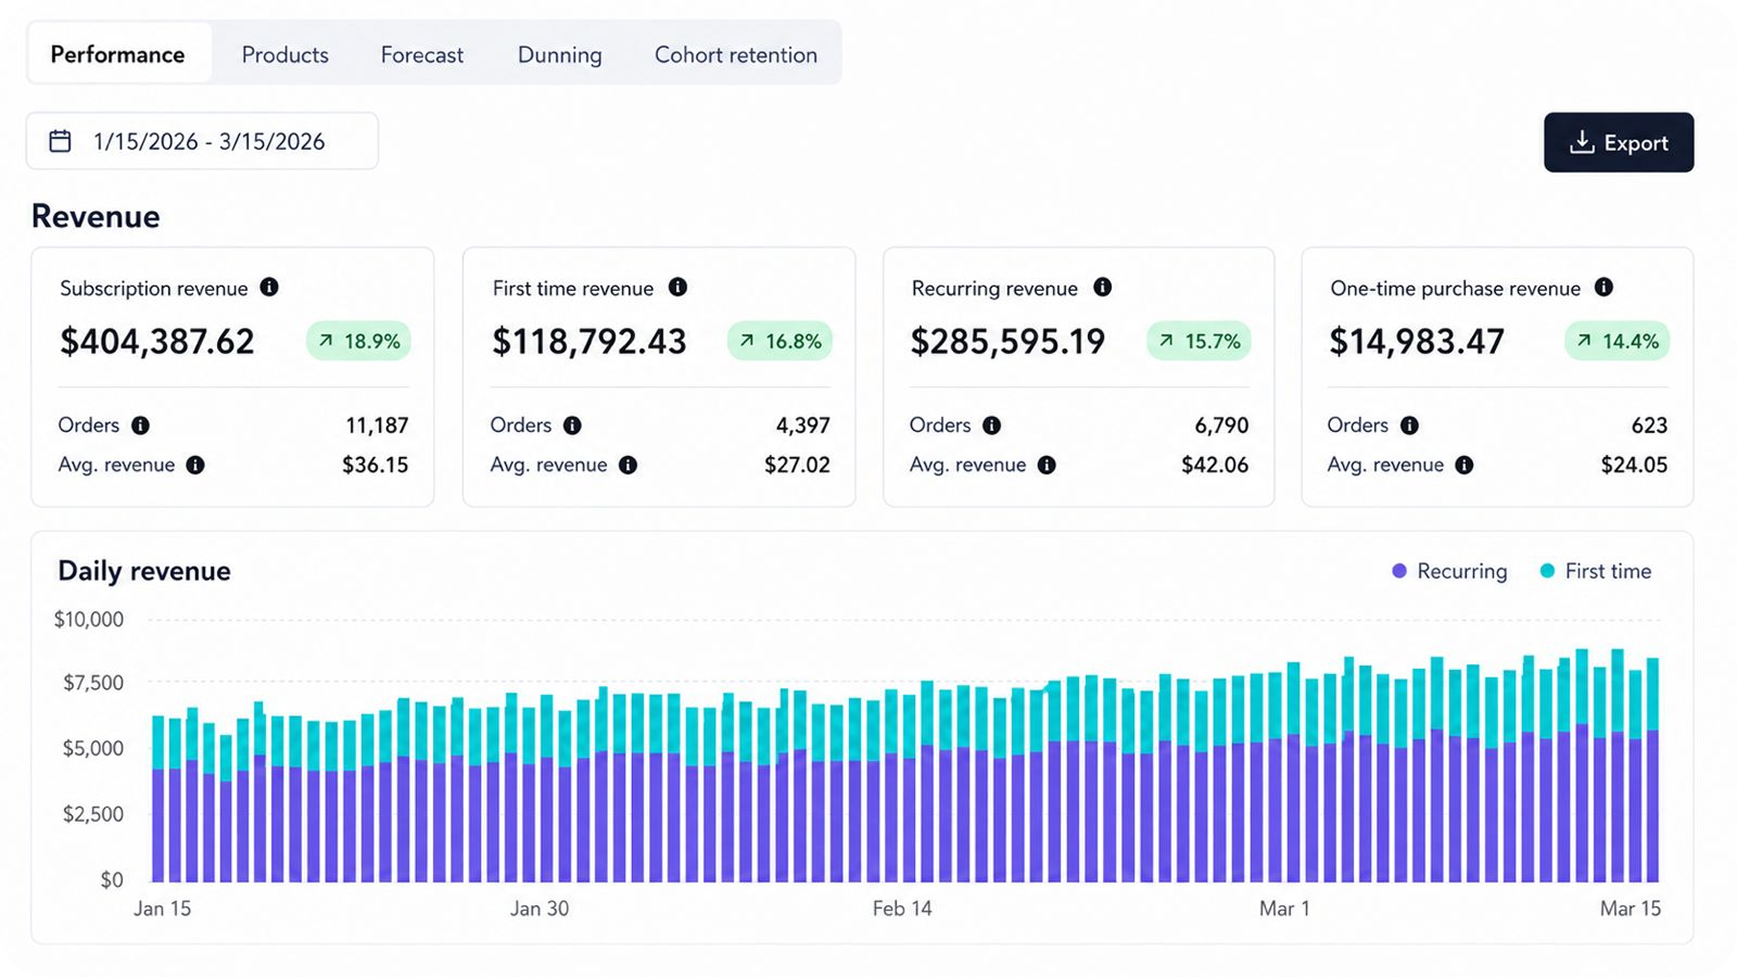
BASELINE: Jan 15 - Mar 15 (60 Day Window)
60 day total from first subscription orders plus recurring renewal orders.
Revenue from the first subscription order. It is already included in subscription revenue.
Revenue from renewal orders, the clearest sign that subscribers are staying and buying again.
Shown separately for context. It is not included in the subscription revenue total.
The baseline metrics explain why the revenue system felt unstable
These benchmark informed baseline metrics show where the subscription system was underperforming.
MONTHLY CHURN
About 15 of every 100 active subscribers left in a typical month.
ORDER 2 RETENTION
Out of every 100 new subscribers, only 38 reached the second order, 62 did not.
SUBSCRIPTION TAKE RATE
Out of every 100 eligible orders, only 7 customers chose the subscription option.
Subscriber controls were hidden
Out of every 100 failed renewal charges, only 12 were recovered.
Cancellation was one size fits all
Out of every 100 people who tried to cancel, only 5 chose to stay.
Failed payments were treated as admin
Across the baseline 60 day window, the average subscription order was $36.11.
What did we do, we rebuilt the subscription journey in six clear steps
Measure the leaks
We established the baseline, then identified where customers dropped, cancelled or failed to renew.
Rebuild the offer
We made subscription easier to understand, more valuable on the first order and more flexible after checkout.
Teach the first 30 days
We added usage education, expectation setting, habit reminders and renewal preparation before Order 2.
Make control easy
We surfaced delay, swap, pause and cadence options before the customer felt forced to cancel.
Recover failed payments
We created a deliberate retry and reminder sequence for billing failures, separate from voluntary cancellations.
Segment and optimize
Prospects, one time buyers and subscribers received different messages because they needed different next actions.
We made subscription worth choosing, not just cheaper.
The old offer asked for commitment without clearly explaining value or flexibility
EVERA DAILY
EVERA DAILY
Build the routine, not the reorder reminder.
Then ongoing subscriber value. The customer can skip, delay or change the next shipment without cancelling.
15 of every 100 eligible orders chose subscription after the rebuild.
The comparable 60 day window produced 3,100 more first time subscription orders.
The average subscription order increased by $3.39.
We rebuilt the first 30 days around one goal, earn Order 2.
Instead of waiting for the renewal date, we gave customers the information they needed before the next charge arrived.
Shipping confirmation, generic product email, upcoming charge.
Education, quick win, routine, subscriber control, future pacing, renewal preparation.
58 of every 100 new subscribers reached Order 2 after the rebuild.
20 fewer of every 100 new subscribers were lost before Order 2.
Monthly subscriber loss fell from about 15 of every 100 to about 8 of every 100.
We made staying easier than cancelling.
Customers should not have to leave just because the next shipment is too soon, the product is wrong or they are traveling
Delay 14 days
Use when the customer has too much product.
Swap product
Use when the customer wants a different product or flavor.
Pause
Use when the customer is travelling or needs a temporary break.
Add to next order
Use when a subscriber wants more value without placing a separate order.
Surfaced proactive controls inside SMS and emails so customers never felt forced to cancel.
We separated failed payments from intentional cancellations.
A failed card is a billing problem. A cancellation is usually a customer fit problem. They need different responses.
Renewal attempts that could not be collected
Subscriptions saved after payment recovery
350 recovered divided by 1,250 failed charges
$44.60 recovered revenue per saved subscription
1. Failed payment recovery
The system kept trying to recover the charge instead of treating the customer as lost.
350 divided by 1,250 = 28.0%. $15,610 divided by 350 = $44.60 recovered revenue per recovered subscription.
2. Reason based cancellation saves
The save action matched the real reason the customer wanted to leave.
Each reason triggers a different save action. The actual cancellation mix is validated from merchant data.
A later 60 day window showed a stronger subscription business.
For the post optimization view, we use Jul 1 to Aug 29, the same 60 day length as the baseline so the comparison is fair.
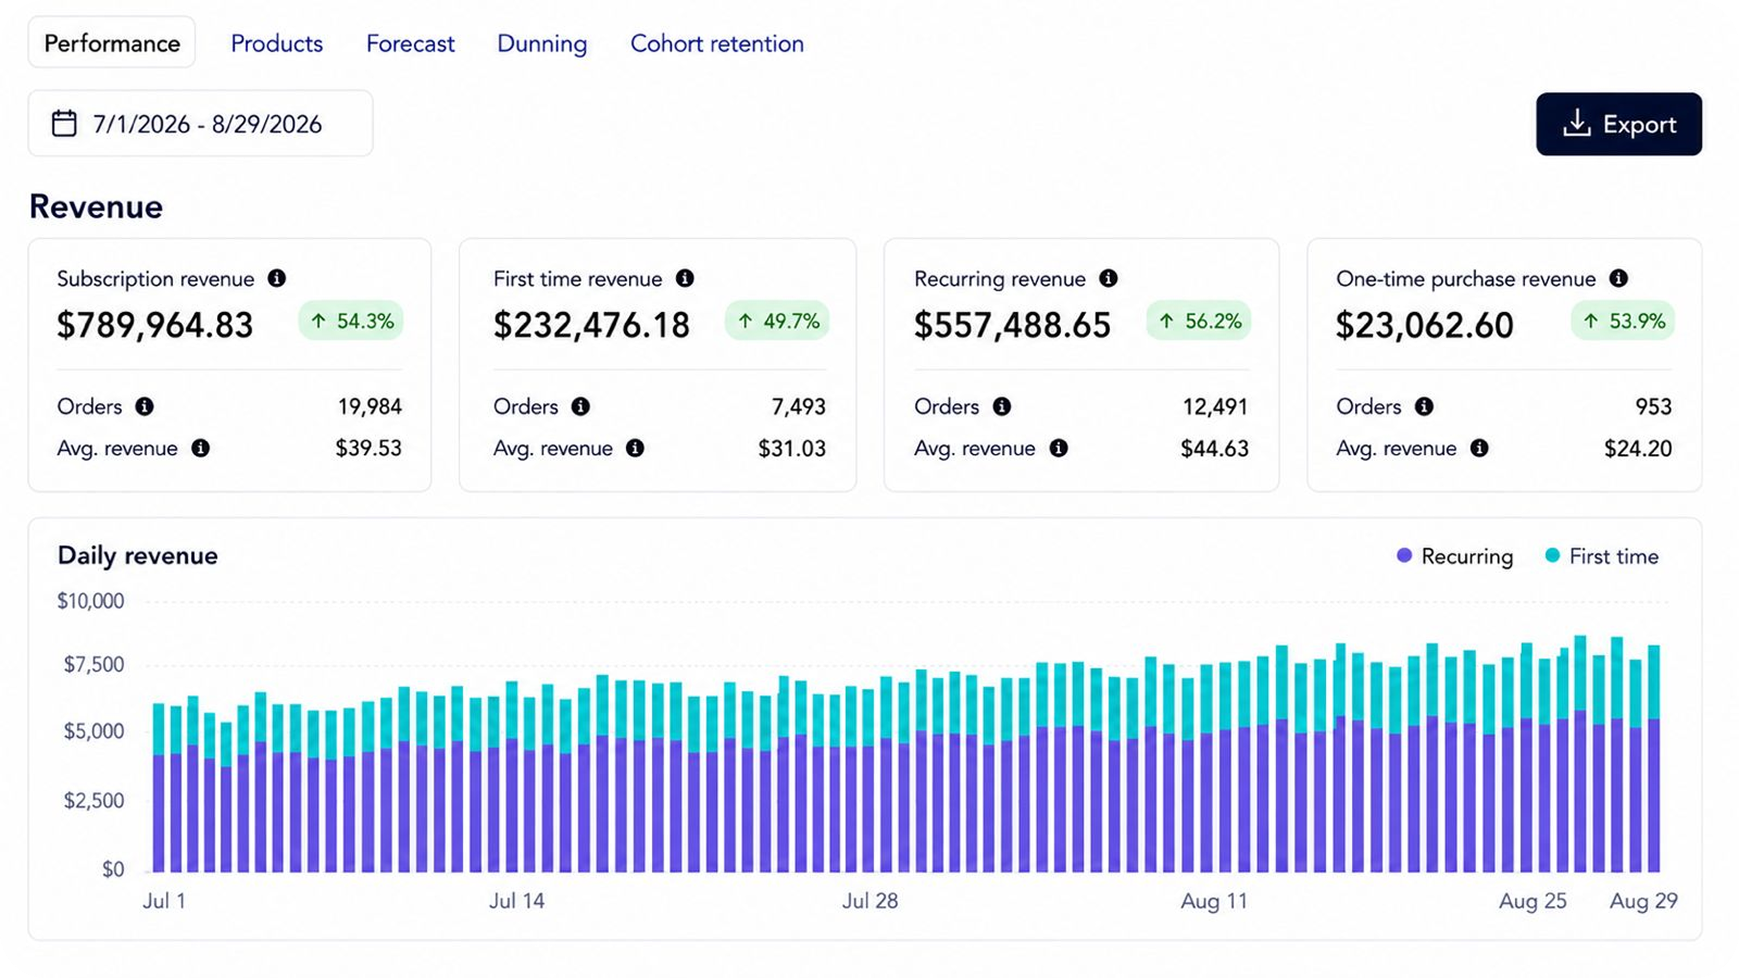
AFTER: Jul 1 - Aug 29 (60 Day Window)
The equal 60 day window produced $385,577 more subscription revenue.
The equal 60 day window produced $271,893 more recurring revenue.
The equal 60 day window produced $113,684 more first time revenue.
The average subscription order was worth $3.38 more.
Revenue improved because subscription health improved too.
These are the same metrics we measured at the start, so every before and after number answers the same question.
About 15 of every 100 subscribers were leaving each month before. After the rebuild, that fell to about 8.
For every 100 new subscribers, 20 more customers reached the second order.
The share choosing subscription rose from 7 of every 100 eligible orders to 15 of every 100.
The recovery system saved 28 of every 100 failed charges instead of 12.
The cancel experience kept 13 of every 100 customers who tried to leave, versus 5 before.
The average subscription order increased by $3.39.
The real change was the system behind the customer relationship.
The framework is repeatable, diagnose the leak, fix the journey, measure the result, then keep optimizing
Make the subscription offer clear, valuable and easy to choose.
Teach customers how to use the product and what progress should feel like.
Protect Order 2, show flexibility and make subscriber control easy.
Recover failed charges and solve the real reason behind cancellations.
Your subscription program should not just exist, it should compound.
“The real question is, how much recurring revenue is slipping away between the first order and the next renewal?”
